Amplitude – Acoustics of Music – Part 6
Scales in Music – A Tonal System
Acoustics of Music – Part 6
Acoustic Principals – Amplitude
Welcome to Part 6 of our article series the Acoustics of Music. The concept of amplitude or loudness of sound will be reviewed to broaden your understanding of the principals of acoustics as related to music.
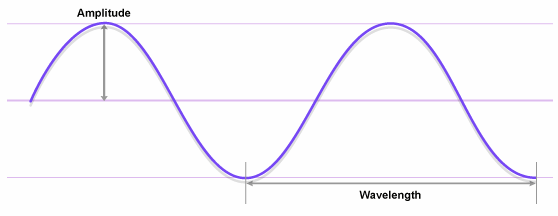
Amplitude – In the previous presentations about frequencies, we learned that amplitude is another property that makes up the characteristics of the sound that we hear. It is also known as the volume or intensity of the sound. Amplitude is measured in decibels (dB). Unlike wavelength, amplitude is measured based upon the height of the sine wave rather than the length as shown below. It is a measure of power or intensity. The higher the peak of the sine wave is the greater the level of power and the louder the perceived sound is to us.
As we have also learned in previous parts of this article is that we hear not only one frequency but many when we hear a sound. Each frequency being part of the whole has its own amplitude and collectively they comprise the overall volume of that sound.
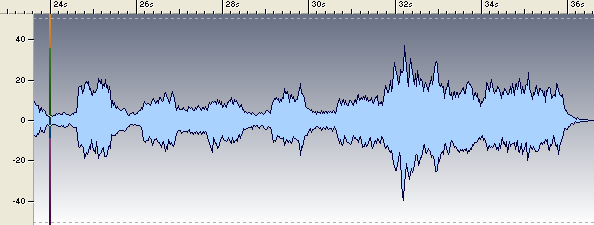
Wave Display Mode – Many people use wave files to make adjustments in the amplitude of sound. Let us take a second look at a short portion of a recorded piece of music. The photograph is a still picture of the wave form. The photo was taken using the Wave Display Mode in Wavelab v6.0.
If you will notice that on the left of the photo is a scale reflecting dB or decibels. The decibel, as a reminder, is the unit of measure used to identify the loudness of sound. Across the top is another scale representing time, in this case it represents seconds of time. As you can see the loudness of the sound varies moment to moment giving us a sense of movement and providing an idea of the range of the variation in the volume of the recorded mix over time.
General use of wave forms when making observations of the amplitude or loudness of a portion of music are useful for the most part however, if you are attempting to master music in preparation for duplication many find it more useful and beneficial to use other tools improving the accuracy of their work.
Loudness Envelope Display – Taking this one step forward the Loudness Envelope Display allows us to more accurately make adjustments to the amplitude of sound when mastering music.
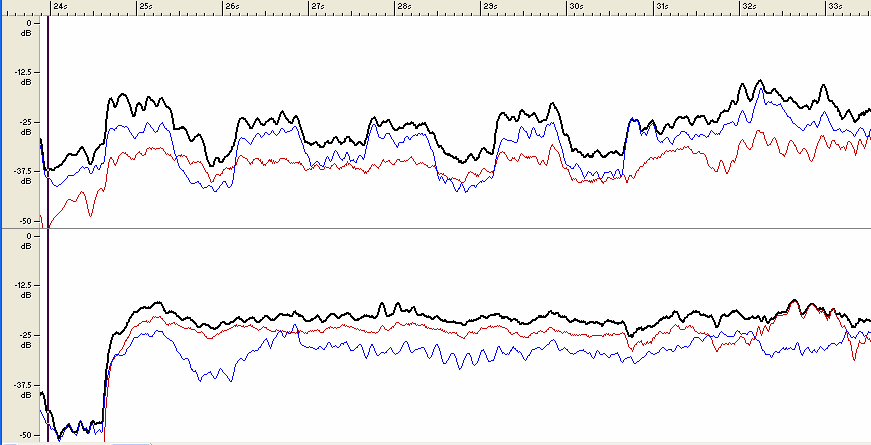
The following snapshot was taken using the Loudness Envelope Display Mode also in Wavelab v6.0.
Note: Both the left and right channels of the recorded stereo sound are shown in the above snapshot.
Here we see the same time scale however we see a totally different idea representing the sound’s volume as compared to the wave file format. The accuracy of pinpointing specific locations along the lines in the graph becomes much easier. Wavy lines such as those shown are recognized as having been compressed to reduce its dynamic range.
Within the Wavelab program, we have the ability to zoom in to the loudness envelope display enabling us to make very small volume changes to the file.
The above snapshot was a view at the 32 second time frame for the same sound sample used in the two previous points. Notice how closely we can not only observe variations in volume or amplitude but how finely we can make adjustments as we determine it to be important to the overall character of the sound file.
If you take a second look at the wave file first shown in this article and compare it to the last you will see not only how engineers do their work when mastering recorded sound but the value and importance in learning more about sound and the tools available that enable an environment for them and you to be most effective when doing this type of work.
Lastly, and only because I absolutely love this program, let’s take a look at the 3D Frequency Analyzer in the Wavelab v6.0 mastering software. Steinberg has recently announced that it is planning a new product release sometime this year for Wavelab v7.0.
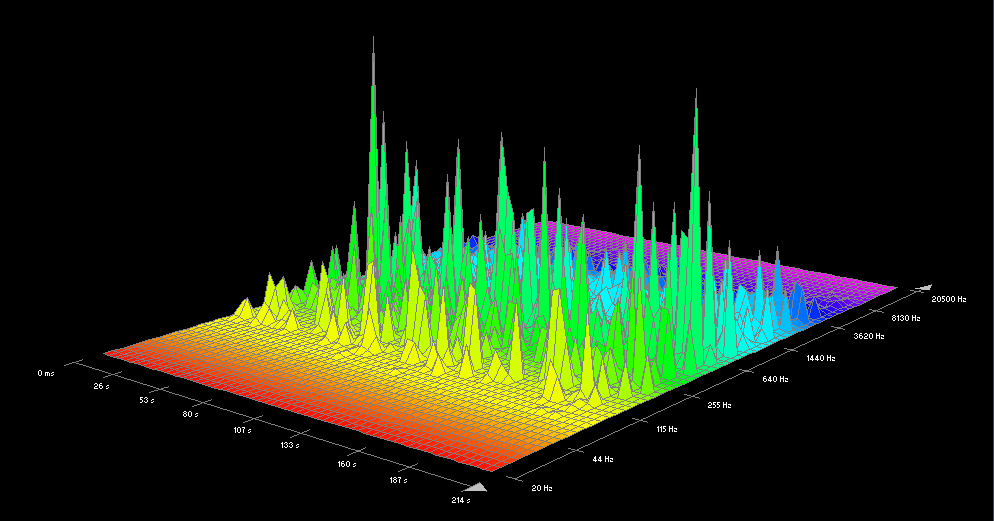
The graphic below shows a pretty cool picture of the same section of music as shown in the previous displays. This time we are using the 3D Frequency Analyzer to look at the frequencies discussed throughout this article.
The time scale is on the left and the frequency scale is on the right. The height of the spikes in this photo represents the volume or amplitude of the sound. The highest spikes in the middle are the fundamental tone, the tone we are most likely to hear, and all other secondary spikes are representations of the various and additional frequencies making up the complete sound.
With tools like these at your disposal, first it’s amazing what modern technology has come to and secondly, I hope you understand them in such a way as to grasp the scope of possibilities that exist in engineering sound. To me, this is totally awesome to work with. In principal you can basically do anything with sound to meet your expectations or goals.
This same photo allows one to see the concept of overtones which was briefly discussed in the article titled Basic Characteristics of Sound. The whole idea of overtones will be discussed in the next article in the series Acoustics in Music.
In Part 7 of our article series the Acoustics of Music we will review more details about overtones including a very interesting photo of a chart showing the harmonic relationships along a guitar string.
Please continue to Part 7 of the Acoustics in Music series. It is titled Acoustic Principals – Overtones.
Mini Series Links
To return to the Music Theory – Level 1 directory for the article listings within the series, please proceed to Music Theory Section – Level 1 – Series Introduction – Part 10.
To continue onto Music Theory – Level 2 directory for the article listings within the series, please proceed to Music Theory Section – Level 2 – Series Introduction – Part 20
To proceed to Acoustics of Music directory for the listings within the mini-series, please proceed to Acoustics of Music – Part 1 – Series Introduction.


